
Built by SM Trading Zone · Browser charting

SmartView Live TerminalStudy price.
Build your process.

Gold, forex and crypto charts. Multiple timeframes. Your own chart studies. Bring drawing tools, candle replay and educational backtesting into one focused workspace.

Works in your browser · No installation needed · Indicative prices · Education only
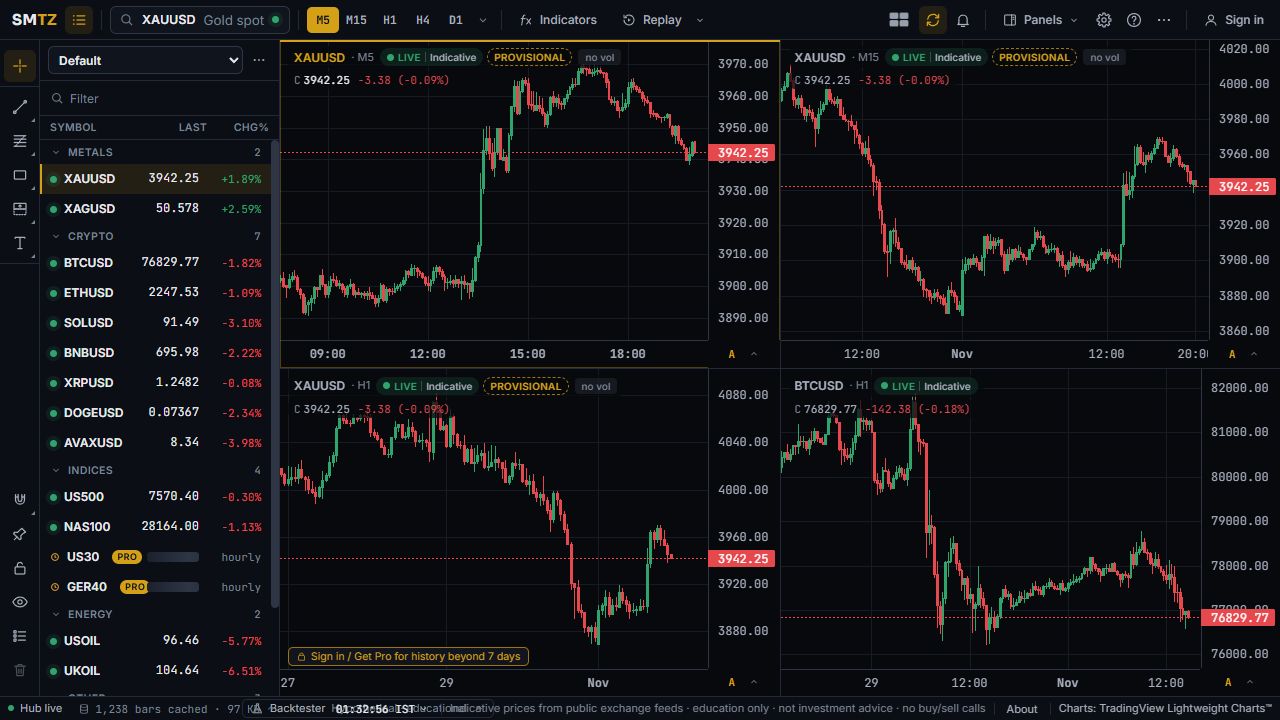
Actual SmartView terminal with a watchlist, drawing toolbar and four charts: gold on M5, M15 and H1, plus Bitcoin on H1
Actual terminal capture · 3 November 2026 · Static preview with indicative prices. Open the terminal for current charts and feed-status labels.
XAUUSD GoldEURUSD ForexBTCUSD Crypto+ More Selected international markets
From chart to chart study

Tools that support your thinking.

Start with what you see, annotate your idea, then revisit it. The terminal gives you a place to do that work.

01 / WORKSPACE

Read the bigger picture

Compare four charts in one workspace. Keep higher-timeframe context alongside your entry-timeframe study instead of repeatedly switching tabs.

02 / WORKSPACE

Mark the chart your way

Use trend lines, Fibonacci retracements, rectangles, notes and position-planning drawings to turn an observation into a clear chart study.

03 / WORKSPACE

Replay a session

Advance through available history candle by candle. Practise recognising structure as it develops, with the replay controls already in the terminal.

04 / WORKSPACE

Test an idea, then review it

Run example rules or your own script on loaded candles. Review hypothetical results and the trade log with the model’s assumptions in mind.

05 / WORKSPACE

Keep useful chart records

Download a chart screenshot or export visible candles as CSV. Save examples for your practice journal and compare them after the session.

06 / WORKSPACE

Build a repeatable workspace

Use watchlists, layouts and chart settings to make study consistent. Pro adds account sync and access to the school’s separate SMC and ICT indicator products.

A practical way to use it

Context. A marked idea. An honest review.

Use SmartView for deliberate practice, not to search for guaranteed signals.

01 / CONTEXT

Compare the timeframes

Put gold on more than one timeframe. Identify the higher-timeframe structure before studying the smaller moves inside it.

02 / PRACTICE

Mark and replay

Draw the levels that matter to your idea. Step through available candles and note what confirms or invalidates your interpretation.

03 / REVIEW

Keep a chart journal

Download your chart image and write down the reasoning. Backtest loaded history when you have explicit rules, then question the assumptions behind the result.

Choose what you need

Explore Free. Go deeper with Pro.

Try the workspace first. Choose Pro when you need the extended history and account features.

Start here

Free browser terminal

A place to explore the interface and practise on recent data.

  • Recent seven-day history on live-symbol charts
  • Multiple timeframes, layouts and drawing tools
  • Replay and backtesting within available loaded history
  • Drawings saved in this browser
  • Chart screenshot download and visible-bar CSV export
Try SmartView Free ↗
For deeper study

Pro $100 / year

Extended stored history and account features under the current Pro plan.

  • Full stored history available for each instrument
  • Selected delayed Pro symbols: US30, GER40 and USDJPY
  • Account sync for drawings, layouts, watchlists and settings
  • In-browser price alerts while the terminal is open
  • Separate SM TZ and ICT PRO school indicators
Compare Pro features & access →

Manual approval after UPI/USDT payment. INR amount is quoted by the owner. No automatic renewal.

Before you open the charts

Your questions, answered.

What is SmartView Live Terminal?
SmartView is SM Trading Zone’s browser-based charting workspace for studying gold, forex, crypto and selected international markets. It brings multi-chart layouts, drawing tools, bar replay and educational backtesting into one interface. It is not a broker and does not place orders.
Can I try SmartView for free?
Yes. Open the free terminal to explore live-symbol charts and the most recent seven days of history. Replay and backtesting use the history available to your plan and the candles loaded on the chart. Pro is optional and has separate access conditions.
Does every chart show live prices?
No. Live, delayed, closed-market and provisional data are labelled in the terminal. US30, GER40 and USDJPY are selected delayed Pro series. All prices are indicative and can differ from your broker; they are not official execution or settlement prices.
Can I draw on charts and save my work?
Yes. Drawing tools include lines, Fibonacci retracements, zones, notes and position-planning tools. Free work is saved in the current browser. Pro includes account sync for drawings, layouts, watchlists and settings.
Can I replay candles and backtest a setup?
Yes. Use bar replay to step through the available history, or run an educational backtest on loaded candles. Results use hypothetical fills and model assumptions, not real executions or a promise of future returns.
Do I need an app, a trading account or a course enrolment?
No installation or brokerage connection is needed for the browser terminal. Open the free version first. Pro is available separately, and enrolled SM Trading Zone students have Pro access under the school’s current entitlement rules. Use a computer for the most comfortable multi-chart workspace.